Objective: Create a report using wizard in Report Builder.
Open Report Builder
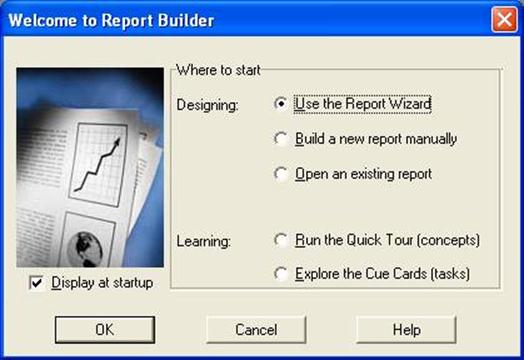
This is the first screen you will see. Select the first option “Use the Report Wizard” and click OK.
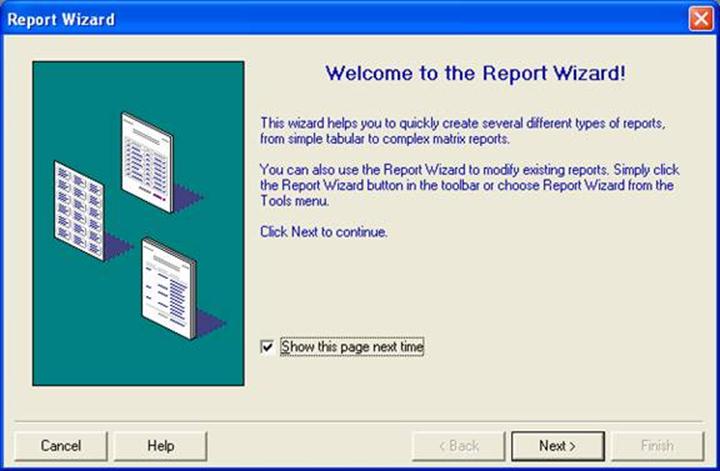
Click Next
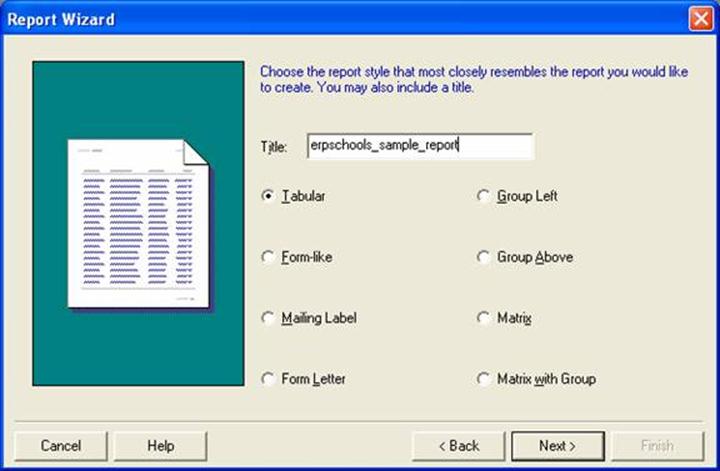
Enter Report Title: erpschools_sample_report and then select “Tabular” option.
As per name “Tabular” our output will be organized in a tabular way (rows and columns).
You can select any option you want based on your requirement/wish.
Then click NEXT
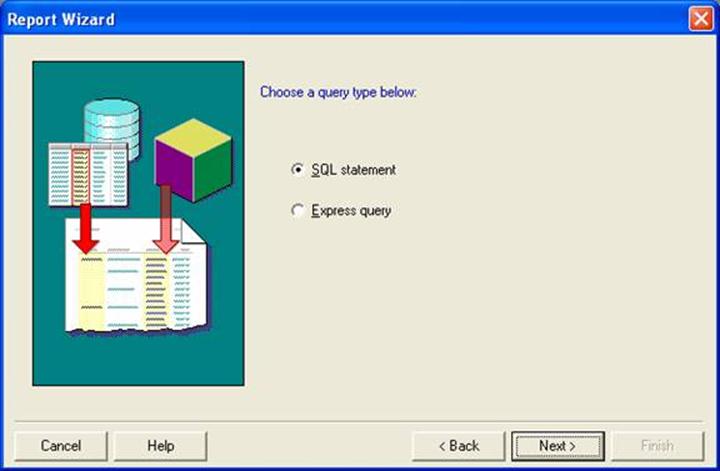
Select the first option “SQL statement” and click Next
SQL statement: If you select this option you have to write the query directly.
Express Query: If you select this option you have to connect to the database and then select the tables/columns you want to display in the report. Simply this is wizard for building the query.
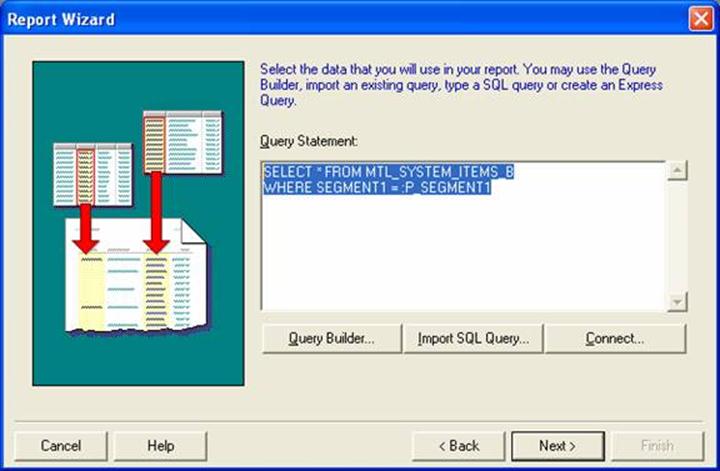
Enter the below SQL Query and then click Next
SELECT * FROM MTL_SYSTEM_ITEMS_B WHERE SEGMENT1 =:P_SEGMENT1
In the above query: p_segment1 is called as bind parameter/variable.
Note: There are two types of parameters that we use in reports. Lexical Parameter and Bind Parameter
Bind Parameter: This is used to pass the values dynamically at run time.
Examples: 1) If you want to see only one item from your inventory and you want to select that item at the time of running report. 2) If you want select only particular department employees and you want to select that department at runtime.
Lexical Parameter: This parameter is used to build the query dynamically.
Examples: If you have two users A, B will be running the report and if use A want to see only columns 1, 2, 3 where as User B want to see columns 2, 3, 4 in that case we build the query dynamically using lexical parameters.
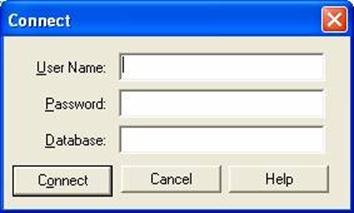
Here you have to enter the username, password of your database. Usually in many development environments username and password will be “apps”.
So enter apps/apps@datbase and click Connect

Once you are successfully connected you will see the above message box.
Action: Click OK to Proceed
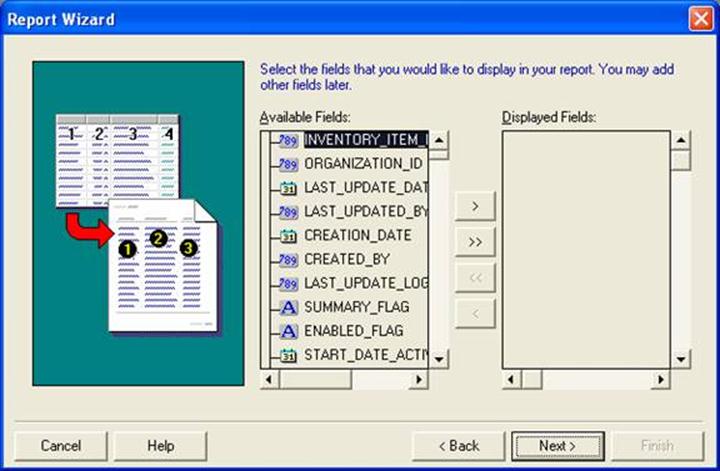
Based on your Query above screen will display the Available Fields. In this case we will have all columns from mtl_system_items_b table. Select the columns you want to display in the report and use arrow buttons to move them to Displayed Fields.
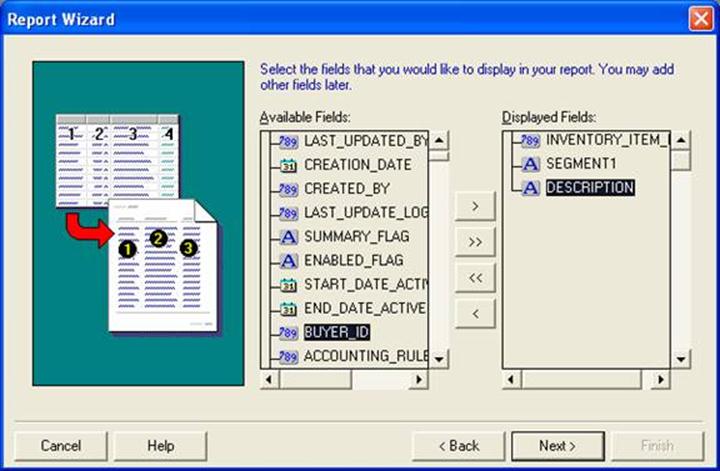
Here I have selected the three columns. You have to select the SEMENT1 column if you have any parameters associated with it, as we have one parameter with it I am selecting that field.
click Next
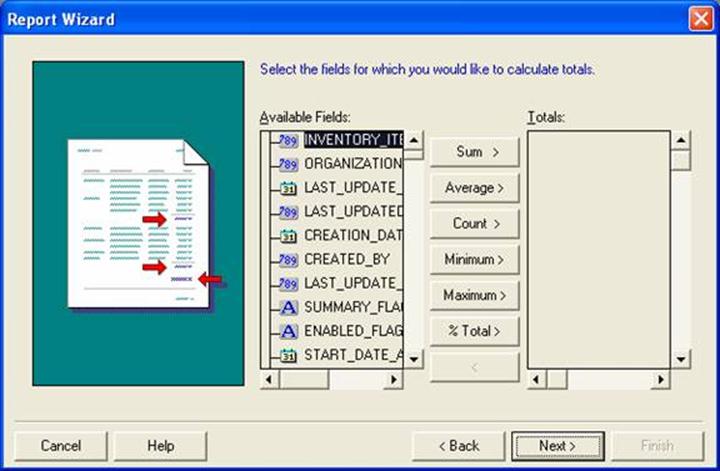
In the above screen you have option to select any Totals/Sum/Averages if you want. Here i will proceed without selecting any.
Click Next
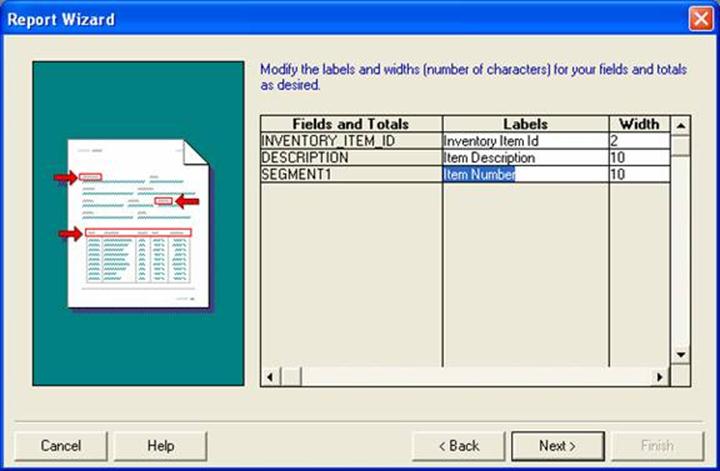
In this screen you have the option to change the heading/display column names in the report. Here i have changed the “Description” to “Item Description” and “SEGMENT1” to “Item Number”.
click Next
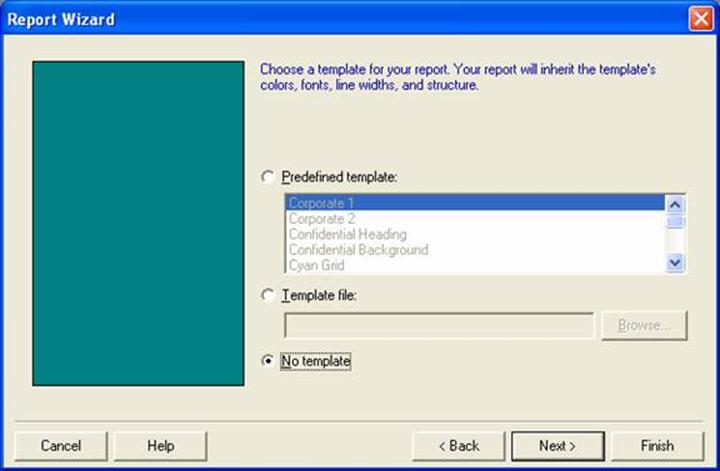
Here you have the option to select any template if you have. I will go with “No Template” option
click Next
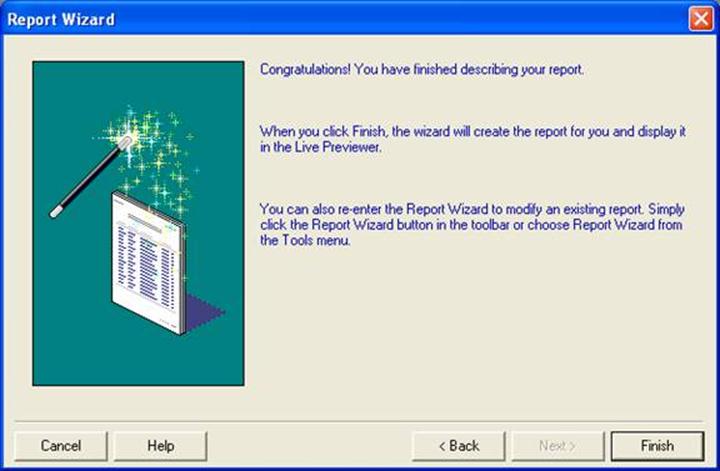
Finally click Finish
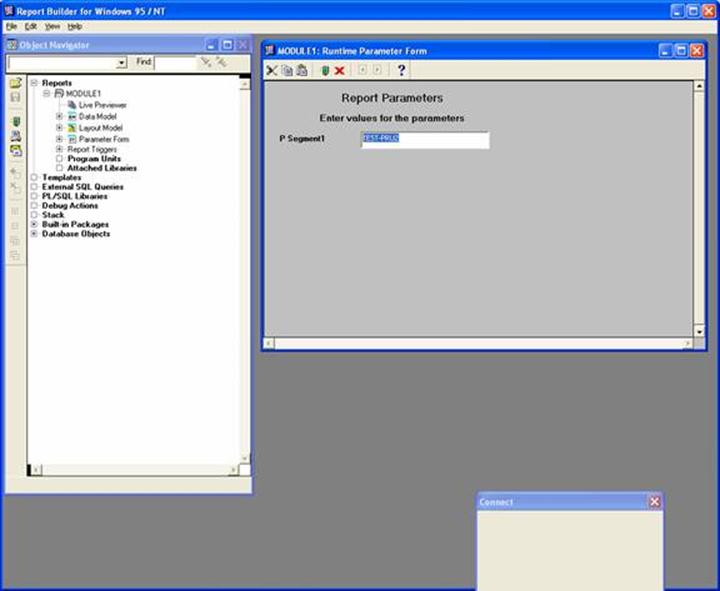
It will prompt you with the “P Segment1” parameter. Enter some valid value and click green signal button to run the report.
Note: To check valid parameters for this report run the below query and copy the output.
SELECT SEGMEN1 FROM MTL_SYSTEM_ITEMS_B WHERE ROWNUM<2;
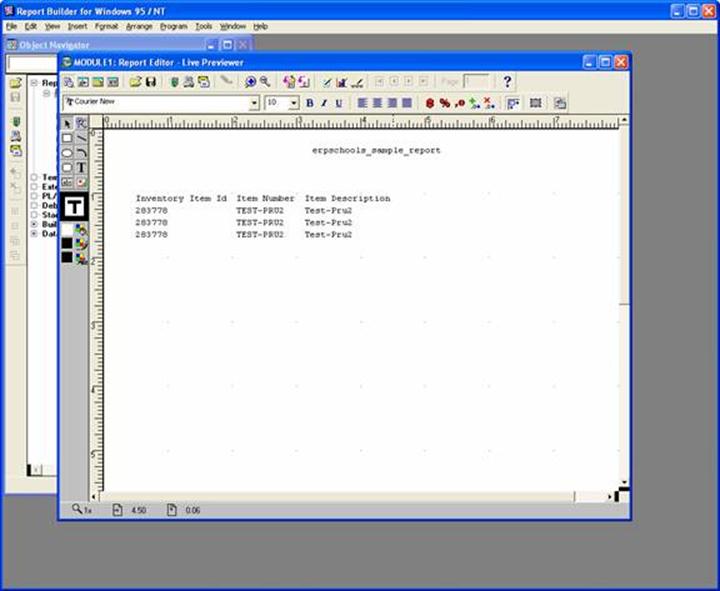
Finally this is my report output.
Click File — Save and enter your report name (sample_report.rdf to use concurrent program registration document for your reference)
Note:
- Click Here to see how to register this as a Concurrent Program
- Once you save make sure that the report extension is .rdf and not .RDF
- Finally move the report file to the reports/US directory of the desired top on your server.