The main use of enabling trace for a concurrent program comes during performance tuning.
By examining a trace file, we come to know which query/queries is/are taking the longest
time to execute, there by letting us to concentrate on tuning them in order to improve the
overall performance of the program.
The following is an illustration of how to Enable and View a trace file for a Concurrent Program.
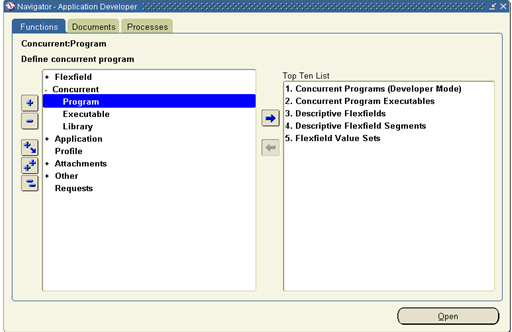
Navigation: Application Developer–>Concurrent–>Program
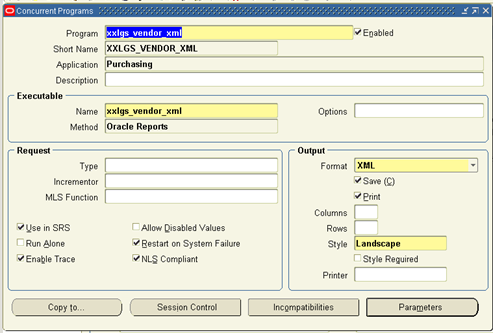
Check the Enable Trace Check box. After that go to that particular Responsibility and run the Concurrent Program.


Check that the Concurrent Program has been completed successfully.
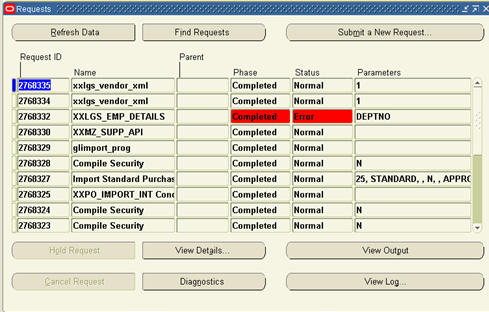
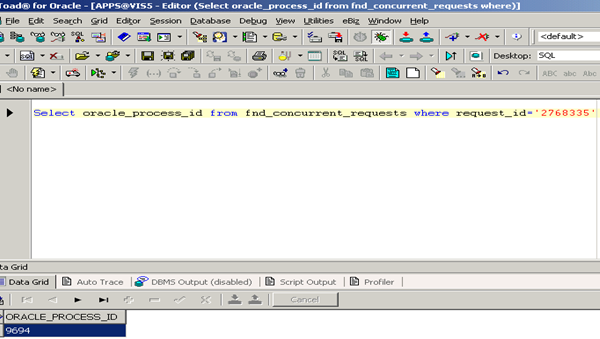
The trace file by default is post fixed with oracle Process_id which helps us to identify which trace file belongs to which concurrent request. The below SQL Query returns the process_id of the concurrent request:
Select oracle_process_id from fnd_concurrent_requests where request_id=’2768335′
(This query displays Process Id)
The path to the trace file can be found in 2 ways
1.Run the below query in the database:
|
1 |
SELECT * FROM V$PARAMETER WHERE NAME=’user_dump_dest’ |
(This Query displays the path of trace file)

2. Login As sysadmin
Navigation> OAM->OAM Setup->Site MAP->Monitoring->System Configuration-> Database Init.ora Setting.
Check out the value for Parameter user_dump_dest which is nothing but the trace file location.
The Trace File generated will not be in the readable format. We have to use TKPROF utility to convert the file into a readable format.

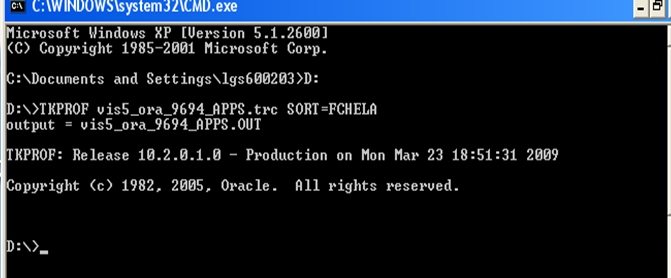
Run the below tkprof command at the command prompt.
TKPROF < Trace File_Name.trc> <Output_File_Name.out> SORT=fchela
A readable file will be generated from the original trace file which can be further
analyzed to improve the performance. This file has the information about the
parsing, execution and fetch times of various queries used in the program.
